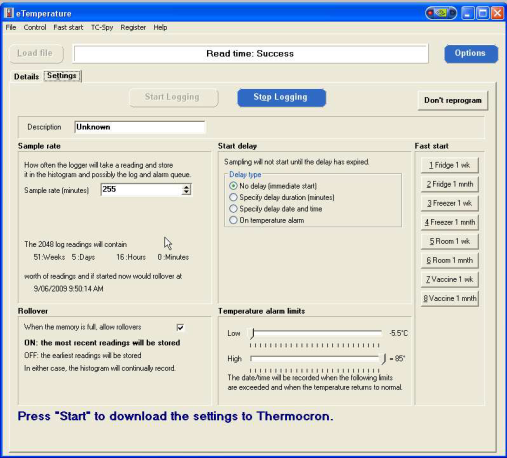
Configuring the alarm limits in eTemperature doesn’t achieve a huge amount, and what it does do can be changes later any way.
When displaying the graph, the high and low bars are set according to these values. Everything above the high alarm is red, everything below the low alarm is blue, and the rest is green.
But of course there are the sliders next to the graph that allow you to change these thresholds later anyway.
