Version 8.21 of eTemperature has now been released. This is primarily a bug fix for the min/max plus extremes report.
Min/max plus extremes
Many customers are familiar with min/max thermometers. They would write the minimum and maximum temperatures down each day and reset the thermometer.
The benefit of this was a very compact record of temperatures. One month would easily fit onto up to 31 lines.
The problem is that if there were high or low readings, there is no indication of when the problem occured or for how long.
Temperature loggers have this information and it can be easily printed out. But then you end up with pages of data.
The compromise is this (IMHO) brilliant report that shows a daily min/max on the days when everything is fine, but then displays each reading that is outside the minimum or maximum.
The end result is the best of both worlds. For days when everything is fine the report only requires a single line, but on days with issues the report shows detailed information.
In the following graph there are a couple of readings that are too high and some that are too low:
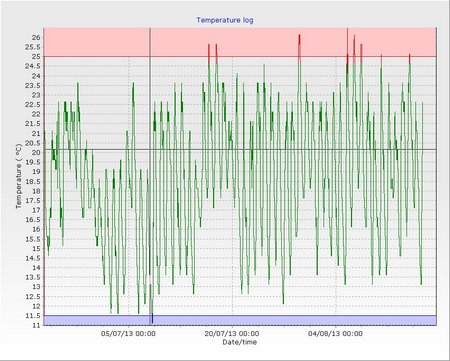
The min/max plus extremes report will look like:
For the first 18 days there were no problems and they require a single line. There was then a period of 13 readings with a problem. You know exactly when the problem occured and for how long.
All up this report required one and a half pages. Not bad for the amount of information it is giving you.