eTemperature version 8.19 has just been released. This is a critical update for all versions since 8.11.
Autosave
The “auto-save” feature has been unreliable since version 8.11.
To also ensure that users are clearly informed as to when results are saved, the dialog box has been reintroduced. This will mean that if you are using the auto-save feature, you will immediately see a dialog box appear saying “results saved in xxxx” once they have been downloaded.
Graph
If the minimum alarm temperature is between 0°C and 3°C, and all the readings have been above it, the graph will “zoom out” to show the minimum alarm temperature. Likewise if the maximum alarm temperature is between 5° and 10°C, and the temperatures were always below it, the graph will automatically “zoom out” to show the maximum alarm temperature.
In the graph below the temperature was always above 1°, but the minimum is 0°. Consequently the graph has zoomed out to show the 0° limit.
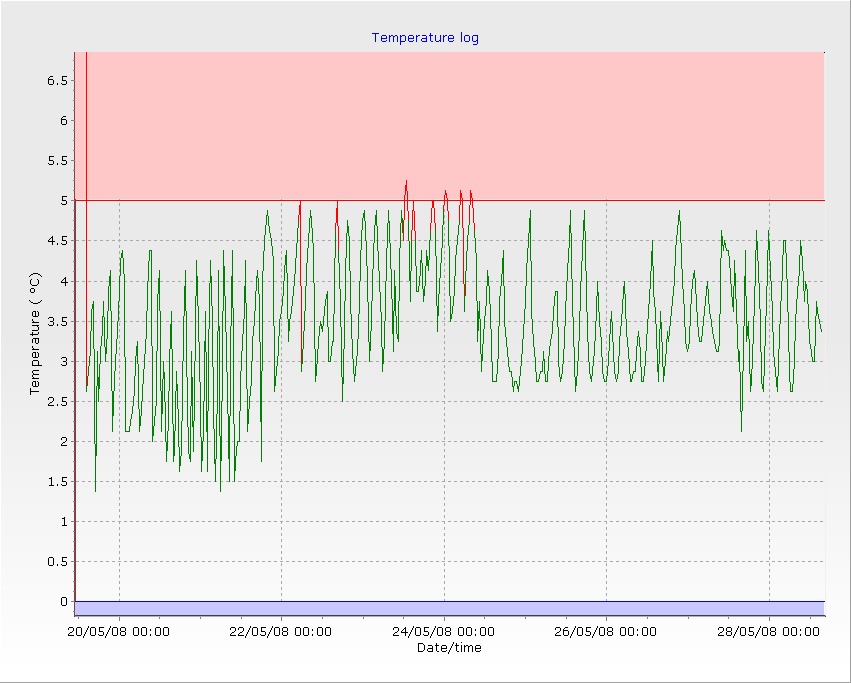
This feature is primarily intended for showing that a fridge is within its limit. A vaccine fridge needs to always be between 2 and 8°C and a food fridge between 0 and 5°C. This will allow the user to automatically see how much of a margin there is.
Other applications menu
The new menu item “Other apps” provides immediate access to the device manager and Problem Step Recorder.
Device manager is useful for determining why a reader is not found. I will write a blog next week explaining what to do with device manager when fault finding.
The Problem Step Recorder (PSR) is also a great tool for helping us support users with problems. It will record every screen and every action made by a user. Once again, a blog next week will help explain the benefits of the tool.
Drag and drop from Explorer
It is now possible to drag and drop a “sav” file from Explorer or emails into eTemperature and have it automatically load the file.