Multi-graph |
  
|
Multi-graph |
|
It is possible to display multiple sets of results on the one graph. A new form is displayed with the graphs on it.
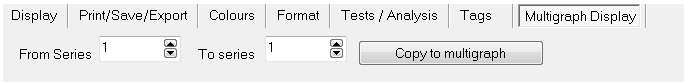
To copy a graph onto the multi-graph form press the "Copy to Multigraph" button.
The "From Series" determines which graph will be copied across when 2 or more graphs (eg temperature and humidity for the humidity loggers) are displayed. For most users it should always be left as 1.
The "To Series" will determine which series the data will be copied to on the destination graph. Up to 8 series can be used. Each series can be individually configured for colour and other attributes. The "To Series" will automatically increment each time it is used.
On the main screen, before a Thermocron is plugged in or results retrieved, the following options are displayed:
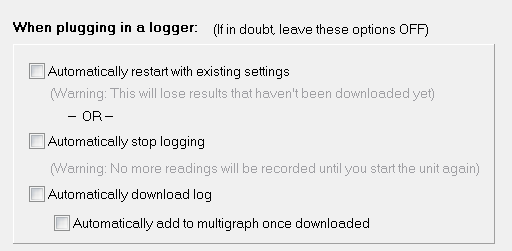
If both "Automatically download log" and "automatically add to multigraph" are turned on then the graph will be automatically added to the next available series on the multigraph.
This feature was designed for where a group of simultaneous results are being loaded and compared.
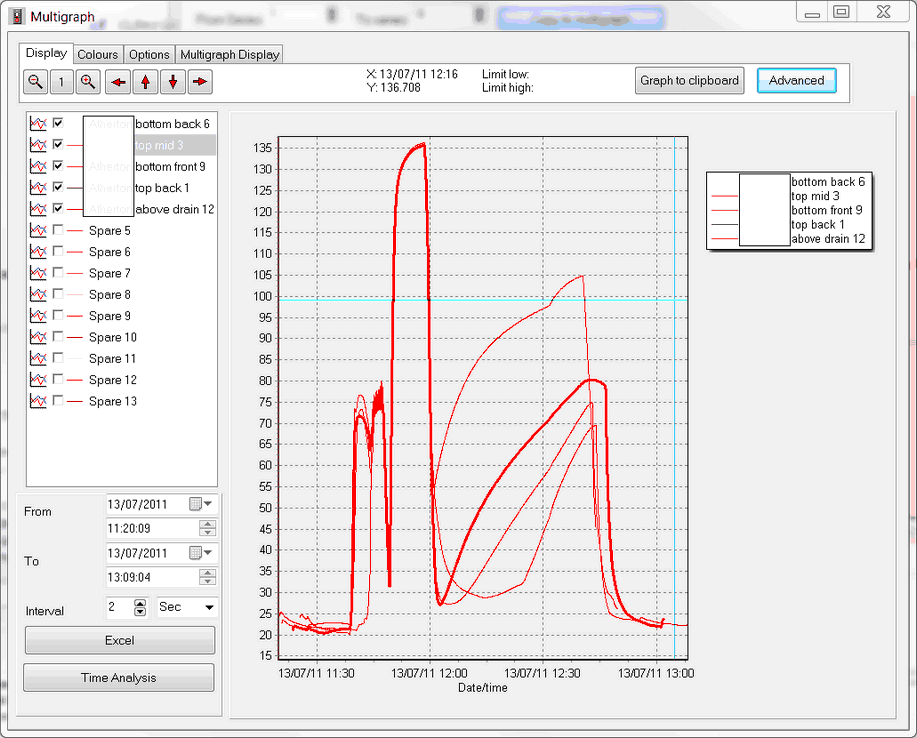
Parts of the multi-graph form are very similar to The Graph and won't be covered in this section of the manual.
The list of results is displayed in the top left column. Individual series of results can be shown or hidden by the check box.
The display is graph only because it is very difficult to align readings in a table. If the underlying data has different sampling rates or different starting times then they can not be aligned perfectly into a table. As a compromise, the Excel export does not do a straight export of raw data. Instead, it will use the from date/time to work out the first row and then the interval to determine the following readings. In the example above it starts at 13/07/2011 11:20:09 and will make a row for each 2 seconds after that (11:20:11, 11:20:13 etc). It will then check each series to see when the next readings are and if they are within this period. If so, it will then export one of these values (typically the maximum) to Excel. If there are no readings in the next interval then the Excel square will be left blank.
The final result of the Excel export for most people will be exactly what they need. The above point is made to clarify why the Excel export may not be as expected.
To remove a series from the results, click on the multigraph tab and there will be an option to clear the series.